
Profiling part of a Perl application
Devel::NYTProf is a great tool to help you figure out which part of an application is responsible for the bulk of the processing time. This information then can drive your optimization effort to the area where you can get the biggest impact.
In an earlier article we saw an example on profiling that gained 100 times speed improvement, this time we take a look at a totally made-up case where we don't want to profile the whole application, only parts of it.
Specifically, we have 5 identical functions, cleverly named a, b, c, d, and e. We call each of them 100 times. We don't expect to have any substantial difference among them.
examples/profiling/full.pl
use strict;
use warnings;

sub a { $_[0] =~ /x/; }
sub b { $_[0] =~ /x/; }
sub c { $_[0] =~ /x/; }
sub d { $_[0] =~ /x/; }
sub e { $_[0] =~ /x/; }

my $n = 100;

a("a") for 1..$n;
b("b") for 1..$n;
c("c") for 1..$n;
d("d") for 1..$n;
e("e") for 1..$n;
We can run our program with the Devel::NYTProf with this command:
perl -d:NYTProf full.pl
that will generated a file called nytprof.out.
Then we can use the following command to generate an HTML report:
nytprofhtml
The main page of the HTML report looks like this:

We can see small differences among the function calls, but, the main point is that we see all 5 functions calls.
Profiling part of the code
What if "a" and "e" are not interesting to us, because, for example this is actually a long-running process and "a" runs only during initialization and "e" runs only during the end of the application. Which means "b", "c", and "d" will, in a real-world situation, run many more times than "a", and "e".
Luckily Devel::NYTProf has tools to handle this scenario. We can tell it to start and stop recording the profiling information by calling DB::enable_profile(); and DB::disable_profile(); respectively.
We can also tell it to be "off" when the application starts by setting start=no in the NYTPROF environment variable.
For this we need to change our application a bit adding:
DB::enable_profile() if $ENV{NYTPROF};
DB::disable_profile() if $ENV{NYTPROF};
The DB namespace is actually related to the built-in debugging framework of Perl. It is enabled by the -d flag passed to perl. Running it with the NYTProf parameter will load Devel::NYTProf and that will install the necessary functions (enable_profile, disable_profile, etc.) in the DB namespace.
The if-condition is only necessary so we won't attempt to call the "DB"-functions if we have not used the NYTPROF environment variable. This will allow us to run the code without NYTProf enabled.
examples/profiling/partial.pl
use strict;
use warnings;

sub a { $_[0] =~ /x/; }
sub b { $_[0] =~ /x/; }
sub c { $_[0] =~ /x/; }
sub d { $_[0] =~ /x/; }
sub e { $_[0] =~ /x/; }

my $n = 100;

a("a") for 1..$n;
DB::enable_profile() if $ENV{NYTPROF};
b("b") for 1..$n;
c("c") for 1..$n;
d("d") for 1..$n;
DB::disable_profile() if $ENV{NYTPROF};
e("e") for 1..$n;
This is how we run the code with NYTPorf loaded, but disabled at the start:
NYTPROF=start=no perl -d:NYTProf partial.pl
The generated nytprof.out can be converted to HTML with the same command as earlier:
nytprofhtml
The main page of the resulting HTML report looks like this:
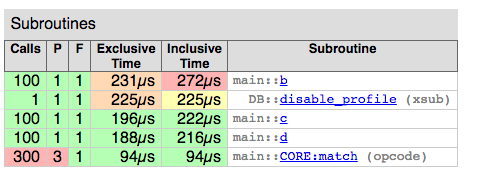
Here you can see that only the functions "b", "c", "d" were profiled. Even the "BEGIN" blocks have disappeared as those reflect the time spent loading modules and pragma.
Profiling selected areas of the code
I don't really have a good excuse for this example, but I am sure there are cases when only selected parts of an applications need to be profiled. Luckily we can switch NYTProf on and off several times during our process with the DB::enable_profile/DB::disable_profile functions.
That's what we do in this examples:
examples/profiling/selected.pl
use strict;
use warnings;

sub a { $_[0] =~ /x/; }
sub b { $_[0] =~ /x/; }
sub c { $_[0] =~ /x/; }
sub d { $_[0] =~ /x/; }
sub e { $_[0] =~ /x/; }

my $n = 100;

a("a") for 1..$n;
DB::enable_profile() if $ENV{NYTPROF};
b("b") for 1..$n;
DB::disable_profile() if $ENV{NYTPROF};
c("c") for 1..$n;
DB::enable_profile() if $ENV{NYTPROF};
d("d") for 1..$n;
DB::disable_profile() if $ENV{NYTPROF};
e("e") for 1..$n;
We run our application the same way as before:
NYTPROF=start=no perl -d:NYTProf selected.pl
We generate the HTML report again:
nytprofhtml
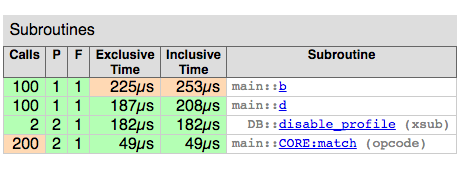
This time the front page looks like this:
Conclusion
Devel::NYTProf is not an all-or-nothing tool. With some little extra work you can select areas of your code you'd like to profile.

Published on 2018-04-16