Test coverage report with Devel::Cover for the Markua Parser
Coveralls indicates a test coverage of 96.88%, but it does not seem to take in account the branch and conditional coverage cases.
Let's see what does Devel::Cover on its own can tell us.
Using Devel::Cover
Luckily we have set up our code as a CPAN module and that way we can use the common method to collect test coverage data. We run:
perl Makefile.PL
make
HARNESS_PERL_SWITCHES="-MDevel::Cover" make test
cover -report html
The output on the terminal looks like this:
Reading database from /Users/gabor/work/perl5-markua-parser/cover_db


---------------------------- ------ ------ ------ ------ ------ ------ ------
File                           stmt   bran   cond    sub    pod   time  total
---------------------------- ------ ------ ------ ------ ------ ------ ------
blib/lib/Markua/Parser.pm      97.2   88.2   66.6  100.0    0.0  100.0   90.9
Total                          97.2   88.2   66.6  100.0    0.0  100.0   90.9
---------------------------- ------ ------ ------ ------ ------ ------ ------


HTML output written to /Users/gabor/work/perl5-markua-parser/cover_db/coverage.html
done.
We can already see the summary of the coverage report, but let's look at the HTML version of the report.
Test coverage report in HTML
When I open the html file in my browser I saw the following:
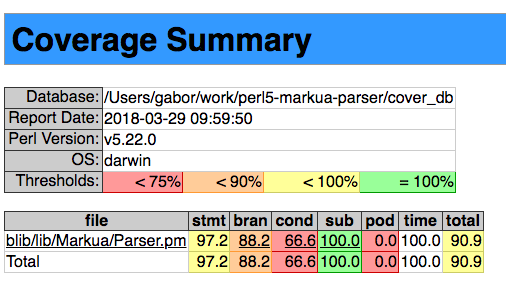
This is much more detailed than what I found on the Coveralls site and while the statement coverage is 97.2% the branch coverage is only 88.2% and the condition coverage is only 66.6%.
To have a reasonable expectation most companies I visit need to work hard to reach even 30% statement coverage. Even open source projects usually have much lower test coverage than this one. On the other hand we don't have a lot of code yet and we tried to be conscious about testing. So that 66.6 worries me a bit. Let's drill down.
Clicking on the filename we get to another report in which we can see the content of the whole file and line-by-line we can see which line was executed and how is the branch and condition coverage wherever they are relevant.
I've scrolled down to the area where we just added the new code:
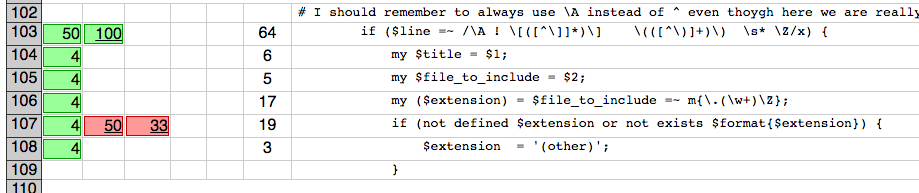
- The 1st column is the line number. (grey)
- The 2nd column is the statement coverage for each line. It is red and has a number 0 when the line was not executed during any of the tests. Otherwise it is green and shows how many times was it executed. Usually the specific number is not interesting to me. Just that it is not 0.
- The 3rd column is the branch coverage. It is 50% in our case. Clicking on that link we get to the page called "Branch Coverage".
- The 4th column is the condition coverage.
- The 5th column is subroutine coverage. Which subroutines were called and which were not. In our case that's 100%.
- The 6th column is pod coverage. We don't have any function-level documentation which is ok for such application.
- The 7th column is the time spent on that line. Not very interesting to us.
- The 8th column is the code in that line.
Branch Coverage
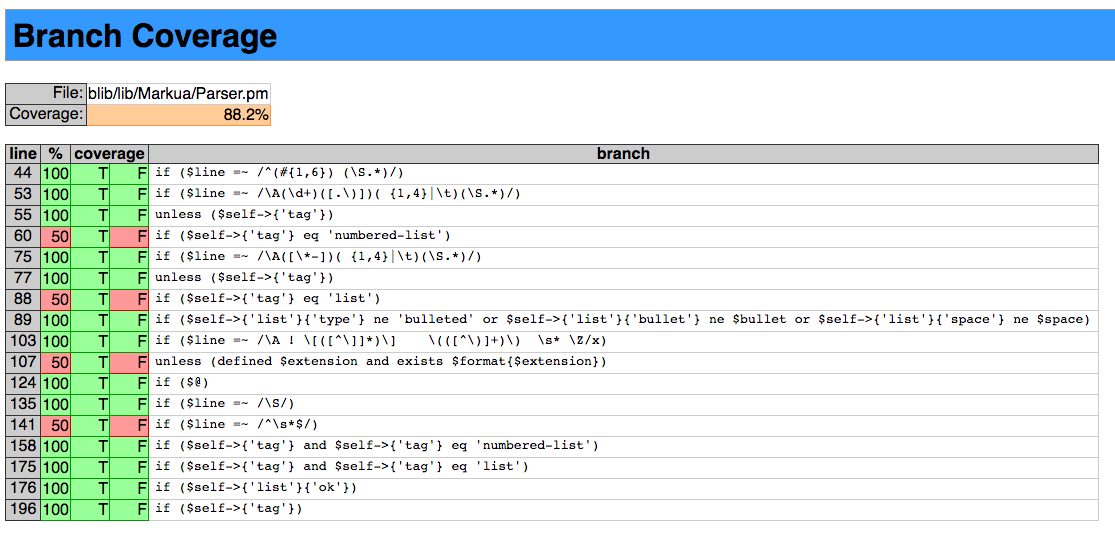
This is a list of all the places where there are 2 branches. An if side and an else side. Even if one of the sides is not implemented and thus can be considered explicitly empty.
If you look at line 107 you will see two important things:
One that the line that in code looks like this:
if (not defined $extension or not exists $format{$extension})
Is now represented as this:
unless (defined $extension and exists $format{$extension})
They have the exact same meaning, but I don't think this change during the reporting is helpful.
Besides that personally I have a hard time dealing with unless statements, but that's a separate issue.
The second, the important thing is that we can see a green T and a red F next to it. That indicates (at least to people who are not color-blind for red-green) that during the test running there was at least one case in which the expression was True and it was never False. The full code looks like this.
if (not defined $extension or not exists $format{$extension}) {
    $extension  = '(other)';
}
The meaning of that report is that the if-block was executed during the tests (at least once), but the invisible and therefore implicitly empty else-block was never executed.
This is where the branch coverage can provide finer report that statement coverage. In this case all the statements in that area were executed. What was not tested, was the case where some of the statements do not need to be executed.
This, together with 3 other red boxes in the "Branch Coverage" report indicated the 4 cases where we could add more tests to cover these other cases as well.
There are a total of 4 red boxes out of th 34 boxes. That 30 out of 34 = 88.2 % of the cases are covered.
Condition Coverage
If we go back to the File Coverage report to line 107, and click on the number 33 (as in 33%) in the 4th column we reach the Condition Coverage report that looks like this:
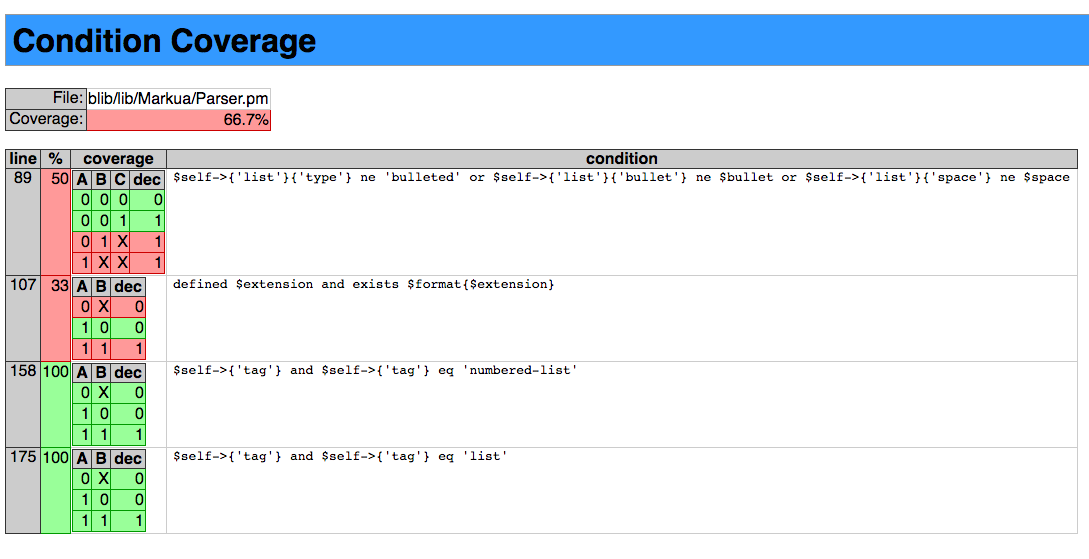
A simple and or or statement can be True or False in 3 different ways. This is what is represented in the these tables. (The first one has 4 lines as it is a combination of two or statements.) In the section about line 107 we can see that out of the 3 cases only one of them is green, the one where A=1 B=0 and therefor dec=0. this is when our reversed expression
defined $extension and exists $format{$extension}
will be True. That's when we execute the if-block. The other two cases were not executed. If you remember we had 3 cases and only one was tested.
In total 9 cases out of 13 were tested that would be 9/13 = 69% but for some reason Devel::Cover uses 8/12 and displays 66.7%.
The calculation does not really matter, what matters is that now we have a much better idea which parts of the code is not tested and which conditions might need to be fulfilled. Then we can go and prepare test-cases that will exercise that part of the code.
Commit
We did not change any code now, but Devel::Cover created a directory for the report. We would like to make sure that directory is not added to GitHhub. So we added its name to the .gitignore file.
git add .
git commit -m "gitignore coverage report dir"
git push
Coveralls report a 96.875% test coverage.

Published on 2020-03-14