Some times ago I have noticed that the Perl Maven site got slower. I thought it might mean I have outgrown the server. Or maybe the the new calls to the MongoDB backend are causing the problem. I even checked what would it cost to upgrade the Linode I have, but as I did not know what is the real source of the problem, I was not sure that would help.
Prepare for profiling
The proper thing to do in this case is to try to find out what is the source of the long processing.
In order to do that I wrote a small script that would load a single page.
My site is using Dancer and it has an app.psgi file that could be used to launch Dancer
via any PSGI compliant server.
I wrote a small program, similar to how a test-script would look like that loads a single page. (Just the HTML part.)
use 5.010;
use strict;
use warnings;

BEGIN {
    $ENV{HTTP_HOST} = 'http://perlmaven.com/';
}

use Plack::Test;
use HTTP::Request::Common qw(GET);
use Path::Tiny qw(path);

my $app  = do 'app.psgi';
my $test = Plack::Test->create($app);
my $res  = $test->request( GET 'http://perlmaven.com/' );

say 'ERROR: code is     ' . $res->code . ' instead of 200'   if $res->code != 200;
say 'ERROR: messages is ' . $res->message . ' instead of OK' if $res->message ne 'OK';
say 'ERROR: incorrect content'                               if $res->content !~ m{<h2>Perl tutorials and courses</h2>};
It loads the app.psgi file using do. As per the requirement of any such file, it returns a reference
to a function that represents the application. Then we use Plack::Test
to provide an environment for the application and finally we use the GET function of
HTTP::Request::Common to send in a request.
Run the profiler
Once the above program was ready I ran the Devel::NYTProf profiler with the following command:
perl -d:NYTProf psgi_profiling.pl
This created a file called nytprof.out
Then I ran
nytprofhtml
which generated a beautiful HTML report.
That report clearly showed that most of the time was spent executing various functions of YAML.
Replace YAML by YAML::XS
I don't have a benchmark for YAML vs YAML::XS, but it seems to be obvious that the latter will be much faster. Just as JSON::XS is much faster than JSON
So I decided to give it a try and replaced YAML by YAML::XS in the whole code.
Though I thought they are fully compatible it turned out that there are several constructs that YAML allows and YAML::XS rejects. Luckily the tests I had complained. Then I spent about 2 hours trying to figure out the specific issues. The fix was easy, just locating the files was difficult. Maybe that too could be explained by the fact that I did this at 2 am after a full day of work.
Once I finished, I ran the profiler again and was happy to see the YAML calls are almost totally gone.
In the morning I've deployed the new version.
This is what the Munin graphs show half a day later:
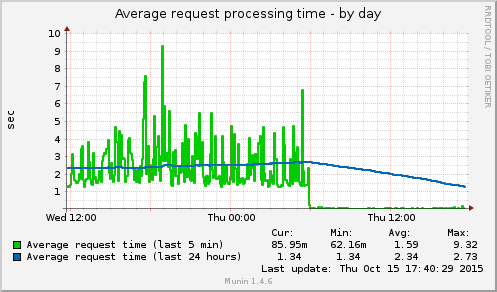
Request processing time
It went down from an average of 2-3 to almost nothing. The graph shows the last 24 hours. The green line shows the average request processing time in the preceding 5 minutes. It dropped immediately once I deployed the new version. The blue line shows the average of the past 24 hours. It will catch up with the green line in 24 hours.
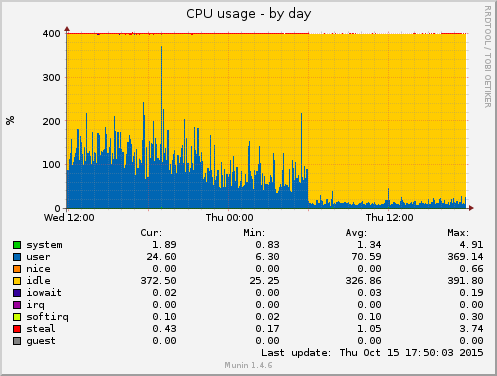
CPU load
At the same time the CPU load also went down.
So based on this I won't need to upgrade the server any time soon, but probably more importantly, you the reader will get much better response time from the server.
