Perl comes with a built-in command line debugger, but many people dislike it as it is not visual enough. There is the venerable Devel::ptkdb of Andrew E Page, but it has not been updated since 2004 and it requires Tk.
Enter the Devel::hdb written by Anthony Brummett and you get a nice web based debugger.
While developing a Perl implementation of a web API, I got some strange issues in LWP::UserAgent and thought I should try to investigate. So I wrote a small sample program and now I'd like to step through it.
use strict;
use warnings;
use 5.010;
use LWP::UserAgent;
use JSON qw(to_json);

my $data = to_json({ fname => 'Foo', lname => 'Bar' });

my $ua = LWP::UserAgent->new( agent => 'Great Perl Agent' );
$ua->default_header("Content-Type" => "application/json");
my $res = $ua->post('https://perlmaven.com/', Content => $data);
say $res->status_line;
say $res->content;
First install Devel::hdb using cpan
or cpanm.
Then run the script using the -d:hdb flag:
perl -d:hdb lwp.pl
This will run the script via the Devel::hdb debugger. It will print to the console something like this:
Debugger pid 5343 listening on http://127.0.0.1:8080/
so I turned my browser to that address:
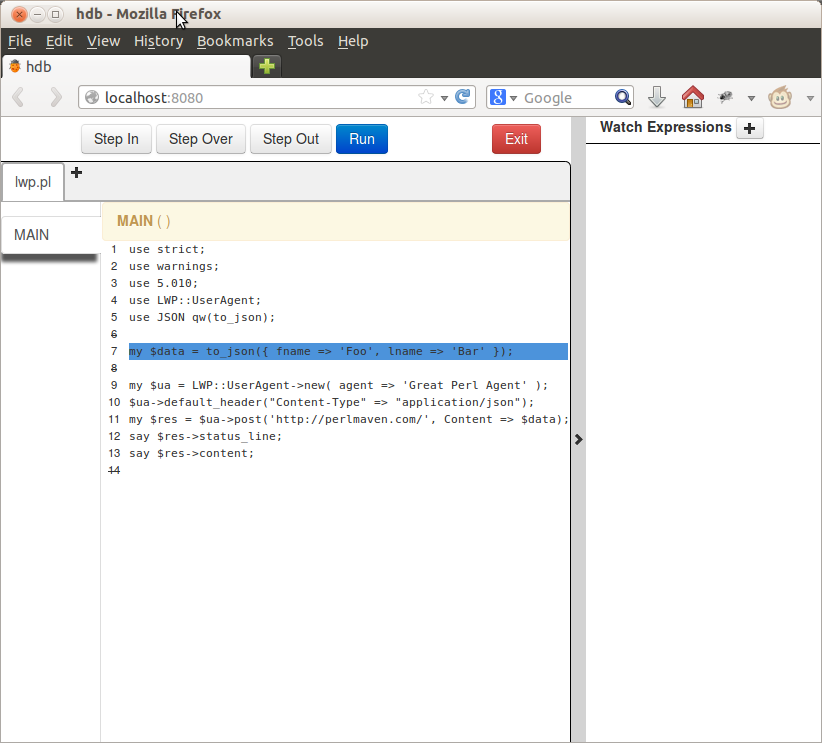
It shows the source code of my script. The statement to be executed
my $data = to_json({ fname => 'Foo', lname => 'Bar' });
is highlighted with a blue line. (see the picture.)
Step Over and Inspect variable
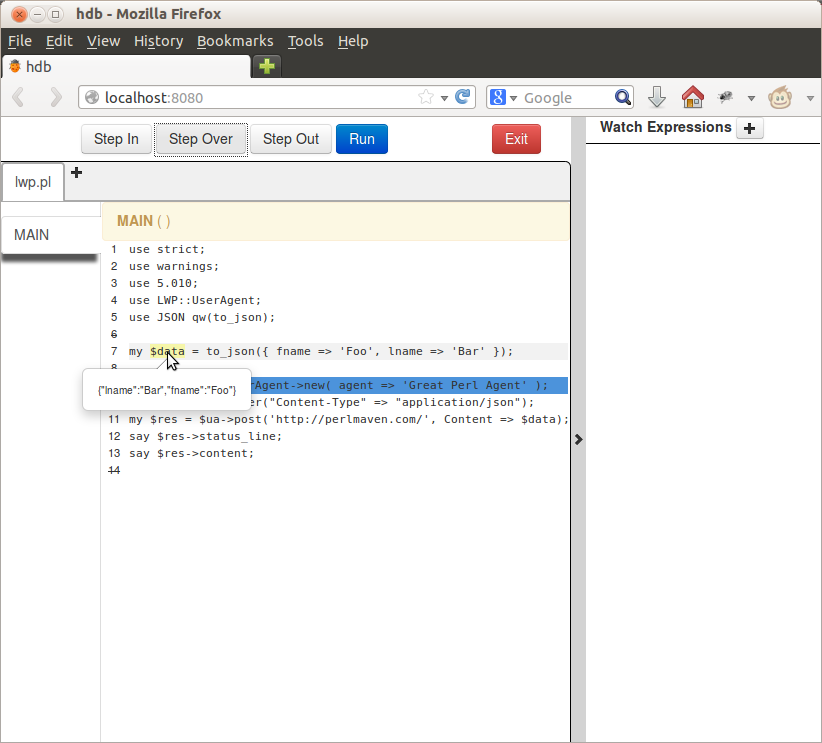
The first line is converting a Perl data structure to a JSON string, but that's not what I'd like to debug.
So I clicked on the Step Over button at the top. This let perl execute the to_json function
and stopped on the next line.
Once it stopped I could hover over the $data variable and see the content:
Watch a variable
The next line my $ua = LWP::UserAgent->new( agent => 'Great Perl Agent' ); creates the
user agent. As the problem I encountered was in the formation of the POST request I did not want to
debug this line either so I clicked on the Step Over button again. I could inspect
the resulting object in $ua, but the content was too big to be seen comfortably in
the the pop-up data inspector and I knew I'll need to check this variable often.
So I clicked on the + of the Watch Expression: + in the top right corner and typed in
$ua. It immediately showed the content in the right panel.
For comparison I also hovered over $ua to show how that displays the content of the
LWP::UserAgent object.
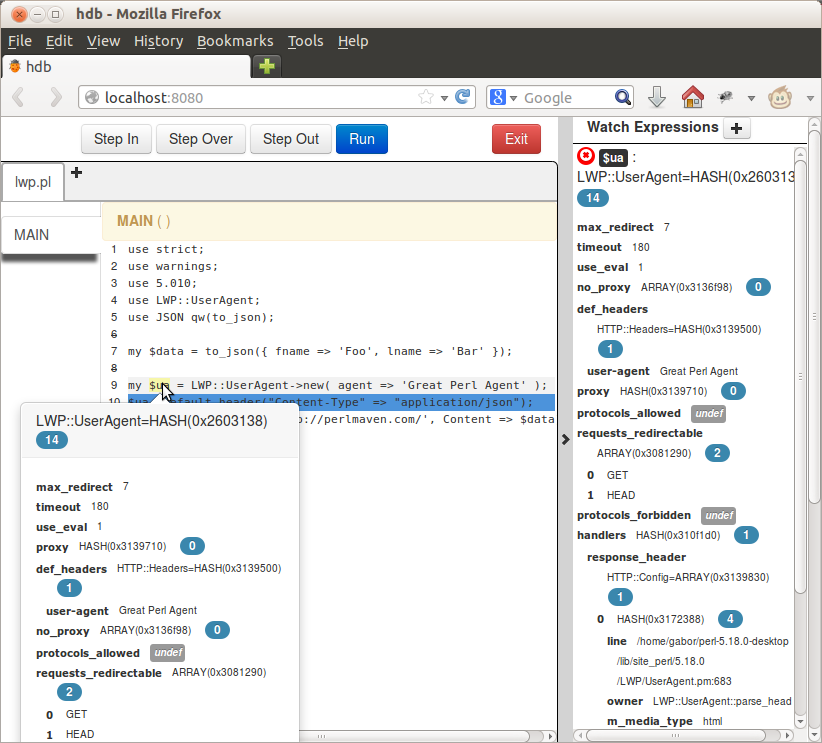
The little blue circled numbers  indicate the size of each data structure.
(Number of array elements or number if pairs in hashes). They can be clicked to hide/show to content of the data structure.
indicate the size of each data structure.
(Number of array elements or number if pairs in hashes). They can be clicked to hide/show to content of the data structure.
Click on Step Over again and see how the def_headers section has been automatically updated on the
right hand side.
Step In
The next line is where the debugging session gets interesting. So instead of stepping over the function, I clicked on
the Step In button. The picture changed drastically:
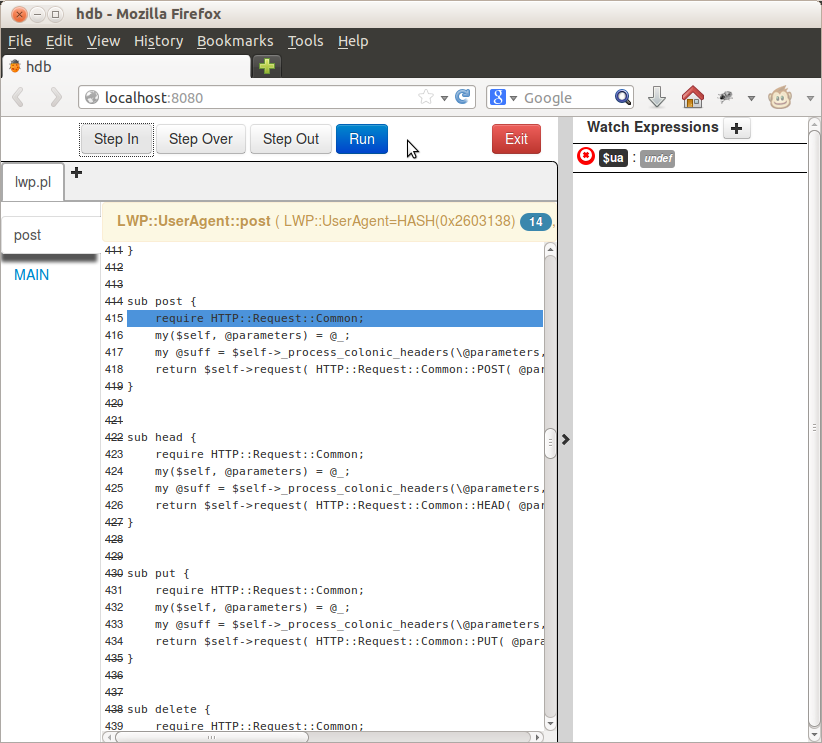
The content of the main panel was replaced by the source code of the post function of the LWP::UserAgent
module, and the first statement in the function was highlighted. This is the next statement to be executed.
The $ua variable we have been watching on the right hand side now shows undef, because it went out of scope.
In the left panel we suddenly see the stack trace of our process. The lower entry MAIN indicates the
main script and the post indicates the current function.
More features
We could go on debugging this script, and showing some other fun features of the debugger, but I think this is enough for a first taste.
The source
Devel::hdb can be found on CPAN and the source code is on GitHub waiting for you to fork and improve.
Comments
thanks for the good hint to Devel::dhb debugger. I've tried your example. But running my Firefox Browser I did not see any panes with file content or other debgger features. Internet Explorer did it too. The only thing I see is some commands.
saveconfig: " /saveconfig" subinfo: "/subinfo" source: "/source/getfilename.pl" stepover: "/stepover" program_name: "getfilename.pl" packageinfo: "/packageinfo" ...
What is going wrong ? Could you please help me ?
